Workflow dashboard
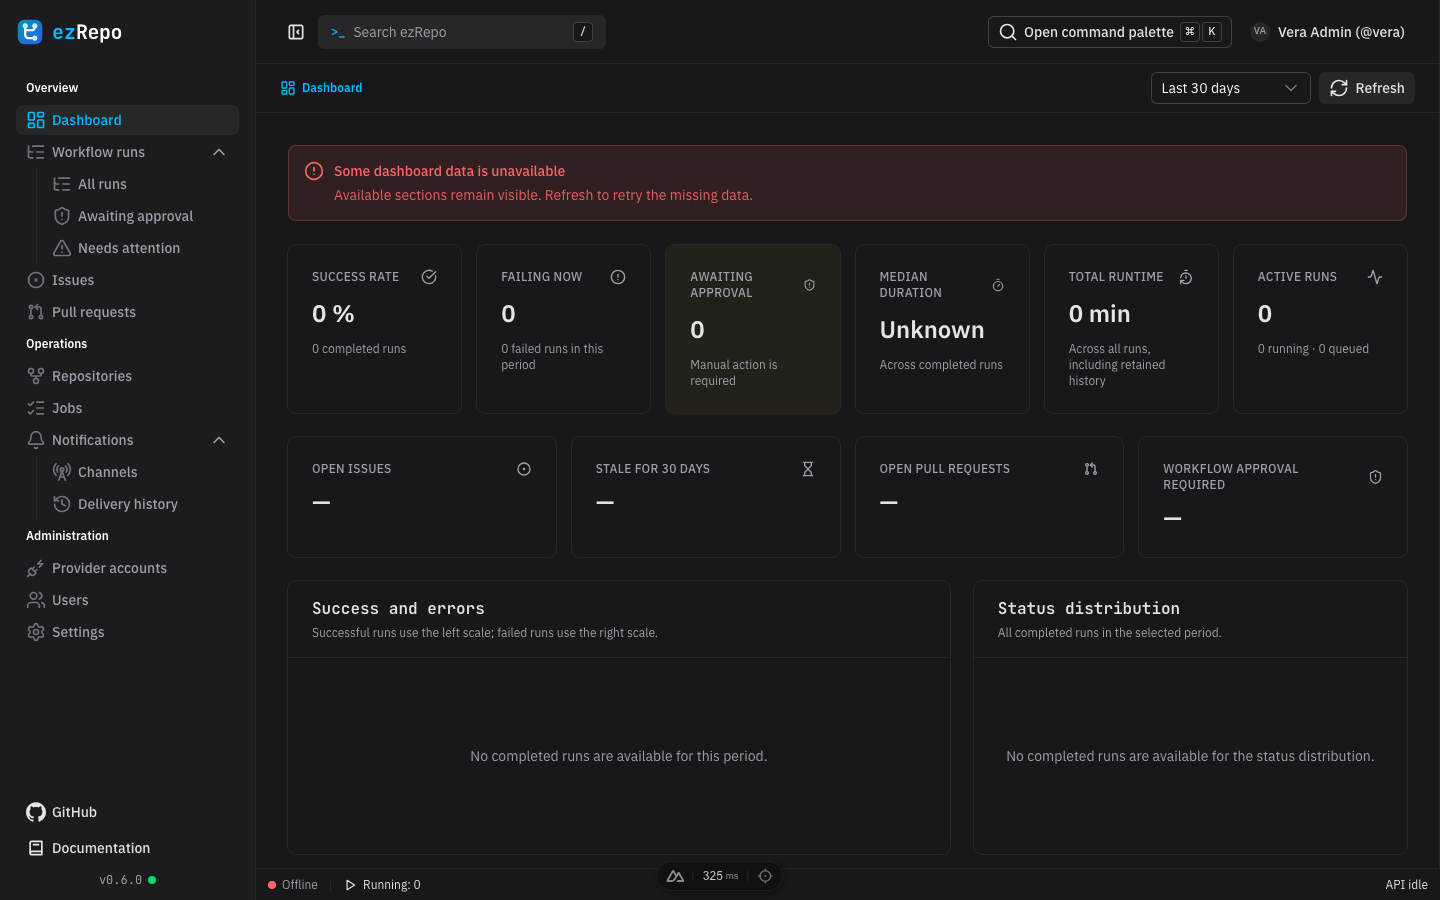
Read the summary
The dashboard combines data only from repositories visible to the signed-in user. Summary cards report active runs, workflows currently failing, runs awaiting provider approval, runtime totals, open and stale issues, and open pull or merge requests. Counts from different users can therefore differ without either view being incorrect.
Choose Last 7 days, Last 30 days, or Last 90 days to change historical charts and repository health. The time range affects completed-run summaries, success/error trends, status distribution, and repository health; current queues and the latest visible work-item counts remain current-state views. Refresh reloads all dashboard sections.
Investigate a result
- Start with Failing now to find workflows whose newest terminal run failed.
- Select View all to open the filtered Needs attention queue.
- Use Latest runs or Open in provider when you need the provider log and run details.
- Review Repository health and the trend chart to decide whether the failure is isolated or recurring.
- Open the issue or pull-request summaries when the failure belongs to active repository work.
Awaiting approval is not a failure count. It identifies runs paused for a human decision and links to the separate approval queue. ezRepo never performs that approval itself; every approval remains an external provider action.
If one request fails, available dashboard sections remain visible and an error banner identifies the partial load. Use Refresh to retry. Empty charts mean that no retained completed runs exist for the selected period, not that provider connectivity has been verified.